
Web Page Monitoring FAQ
Frequently asked questions about Wachete - how to monitor web pages for changes, set up email and mobile notifications, integrate with Slack, Teams, Discord, and Zapier, use the REST API, and manage your free or paid subscription.
Getting started with web page monitoring
How can I monitor a page?
You can start monitoring any web page by following these 3 simple steps:
-
Click
- Select "Single page or part of it, password protected page or media file" option and enter your page URL
- Pick monitoring frequency and type of notifications.
Does my PC or phone have to be switched on and connected to the Internet at all times to monitor pages?
No. All monitoring runs on our servers, which are located in different locations around the world.
Is it possible to see visual changes preview on the actual page?
Yes. Edit your monitor and set What would you like to extract? to HTML. Afterwards in Monitor details and history table click on small icon Show visual differences under date.
Preview of differences will open.
Example:
Can I generate a RSS feed from a webpage?
Yes. After you created a monitor, go to the detail of the monitor. Click on the RSS icon and you will get the URL to your RSS feed for changes in values or for notifications triggered. Afterwards add this URL to your favorite RSS reader.
I deleted by accident my monitors or folders, can I recover them?
Fortunately it is possible. Navigate to your profile and go to tab called Account.
You will find section to recover deleted monitors. Choose period to recover. You will find your monitors back in your monitors.
Can I monitor my server certificate and be notified when it's going to expire?
Yes, with Wachete you can monitor your server certificate and be notified before its expiration.
When creating a new monitor, click +Show advanced options and in Specify content type select Headers and certificate only.
To monitor your certificate's expiration, just select the hoursToExpiration value and set up a Notification:
Notify me when the [value is less than] 720
to be notified 30 days before your certificate expiration.
Notifications and change alerts
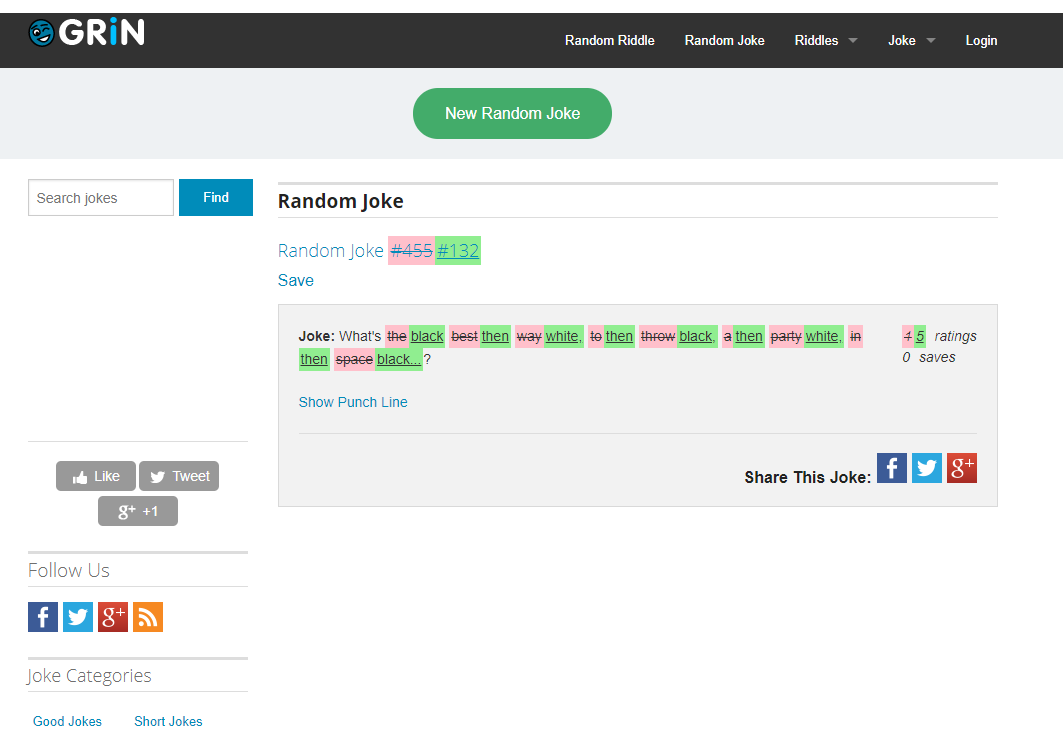
What does the notification email look like when a website has changed?
Red text represents removed content, and green text represents content that was added to the page.
Hi there!
You wanted to be notified about changes, right? So here they are…
Monitor name E15.cz - News, politics
URL http://e15.cz/
...Elections of the President of the Czech Republic by the Parliament of the Czech Republic were held on
...
I'm getting error notifications which I'm not interested in. Can I filter them out?
If you want to disable all error notifications edit monitor definition and uncheck Notify me when an error occurred option.
If you want to disable only specific error like The server returned an error response: ServiceUnavailable navigate to Notifications and click on show details of the error notification you would like to disable.
At the bottom, there is an Ignore button that will ignore the same error notifications for this monitor in the future.
To enable notifications again edit monitor definition and navigate to +Show advanced options. Under Notifications tab you'll see Ignore error notifications where you can select errors which you want to enable again.
Can I receive notifications to multiple emails?
Yes. In your profile add a new email address. After that, when creating/editing a monitor, open the advanced settings section and choose to which email the notifications should be sent.
What is the "Notifications" section in the navigation bar?
There you can find all the notifications that have been triggered for your monitors. For example, when we find out that a web page has changed, we notify you via email or via push notifications in the mobile app. Don't forget to set up notifications while creating your monitor.
Can I set different conditions for being notified via email?
Wachete's most popular notification is triggered when a web page changes, but you can also set up a notification when a page contains specific text, or when a numeric value on a page reaches a threshold or starts growing. And many more.
Can I receive an SMS or trigger another action when a page has changed?
Yes. Wachete integrates with Zapier. Just create a Zap where the trigger is a Wachete notification
and then send it via SMS. You can create any other automation, like updating Google Sheets, creating a task in your task list, or tweeting on Twitter.
We also integrate with Pabbly Connect which can do similar things.
Can I receive web change notifications in Slack, Google Chat, Discord, Telegram, or Microsoft Teams?
Fortunately, we support this. Add this application to your Slack workspace.
Afterwards, take your webhook URL from the new application (https://hooks.slack.com/services/EXAMPLE) and paste it when editing monitor, in Advanced section and Notification tab, into field Webhook. That's all.
For Google chat you can find manual here on how to get webhook URL. Afterwards edit your monitor like described for Slack above.
For Discord you can find manual here on how to get webhook URL. Afterwards edit your monitor like described for Slack above.
For Microsoft Teams you can find manual here on how to get webhook URL. Afterwards edit your monitor like described for Slack above.
For Telegram create bot via BotFather as described here and add bot to your chat.
Afterwards edit your monitor and in Advanced options in Notifications tab enter into WebHook field URL in format: https://api.telegram.org/bot{TOKEN}/SendMessage?chat_id={CHAT_ID}
Replace {TOKEN} with your API token obtained from BotFather when creating the bot.
Replace {CHAT_ID} with the ID of the chat you want to send messages to. Once you add the
bot to the chat, you can get the chat ID by calling https://api.telegram.org/bot{TOKEN}/GetUpdates and taking the ID from the chat section.
Can I create my own expression and condition for notifications?
For monitoring numeric values, you can choose the notification type expression. You can write a simple evaluation; if it evaluates to true, we will send a notification.
Example: cv > pv (You will be notified when current value is bigger than previous)
Variables: cv (current value), pv (previous value)
List of all supported functions can be found here.
In case you use Compute monitor all variables which you defined related to monitors involved can be used in above expressions and notifications.
Useful expressions
Notify me only when the value crosses threshold 10: cv >= 10.0 and pv < 10.0
Notify me only when the value goes up by predefined step 1.5: floor(cv / 1.5) > floor(pv / 1.5)
Notify me only when the value changes by predefined step 1.5: floor(cv / 1.5) != floor(pv / 1.5)
Notify me when the current value contains Berlin but not Praha case insensitive: contains(cv, 'berlin') && !contains(cv, 'praha')
For compute type monitors you can use variables you defined contains(monitor1_value, monitor2_value)
How does the content of the webhook look
In the advanced section of the monitor settings, you can specify a webhook that we call when any alert is triggered. The HTTP operation is POST and this is how the JSON content looks:
How can I make sure that the webhook was really sent from Wachete?
To make sure that the webhook was sent from Wachete service, you can verify webhook signature sent in x-wachete-signature header. To get your webhook secret go to Profile -> API.
PHP code for signature verificationC# code for signature verification
Can I use regular expressions for notifications?
Yes, you can! Here are a few examples of regular expressions that might be useful:
Match whole word:
\bword\b
Match 2 words separated any character except of new line:
.*important.*change.*
Match 2 words separated any character and also new line:
.*important[\S\s]*change.*
Match at least 1 of 2 words:
(.*word1.*)|(.*word2.*)
Setting up monitoring
I'm getting "Forbidden" or the page content is not loading properly. What could I do?
There are several options you can try if the page content is not properly loaded:
-
While in page preview, try switching to Dynamic, change Monitoring location or combination of both
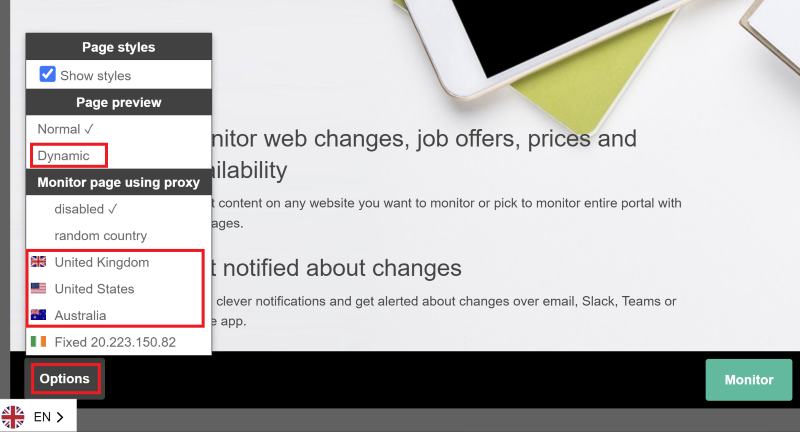
- A common reason for getting "Forbidden" responses from the server is that it is protected against automated bots like Wachete. In such a case you could try to use a rotating residential proxy as described here.
What do the small icons in front of monitor name mean?
Icons have following meaning
⚛ - dynamic monitor (you monitor javascript rendered page)
ᐅ - flow monitor (interaction with page, like inserting login/password)
▤ - crawling monitor (auto discovery of sub-pages from root page)
⚙ - compute monitor (using several monitors to calculate new value)
What is the difference between static and dynamic pages?
In general, most pages can be monitored as a static page. Some pages where content is generated by JavaScript, like stock prices or other dynamic pages with graphs, should be monitored as dynamic. You can easily find out if you need to monitor a page as dynamic. If you open the page in our preview and can see the content you want to monitor, it is a static page. If you need to switch preview options to dynamic to see your content, then the page is dynamic. Dynamic monitors have symbol ⚛
How can I find all my dynamic monitors?
There are three ways to find your dynamic monitors:
- Dynamic monitors are marked with the ⚛ symbol in front of the monitor name.
- In the search box above your monitors, type type:dynamic and click the Search button. This searches across all your monitors in all folders.
- Go to Profile → Account and click Export monitored URLs. The downloaded Excel file contains a Dynamic Monitor column that identifies which monitors are dynamic.
In the "My Monitors" section, why the time on the monitor is higher than 1 hour although I set it to check every hour?
In the "My Monitors" section, we are showing the last time when something has changed. The most recently changed monitors are on the top of the list. Once you get into the detail page of the monitor, you will see the time when we last checked the page and the time when it has changed.
How can I ignore a section of a page that generates irrelevant notifications?
If your page contains part like date and time which constantly changes and you want to filter such noise, you can either switch in preview to exclude mode on top and mark parts to
ignore or you can edit monitor and in advanced options enter Exclude Xpath
Useful XPaths
Ignore div elements with class 'date': //div[contains(@class, 'date')]
Ignore all links: //a
Ignore all HTML comments: //comment()
Ignore specific attributes: //*[@attribute_name]/@attribute_name
Ignore attribute style which contains text opacity and width //div[contains(@style,"opacity") and contains(@style,"width")]/@style
Ignore elements with attribute test: //*[@test]
All topics which does not contain text 'Miss': //h2[not(contains(text(), ' Miss'))]
More info about xPath can be found here
The monitored page shows a cookie consent banner. How can I remove it from the preview?
There are two ways to deal with cookie consent banners:
Option 1 - Hide the element
In the Wachete page preview, click on the cookie consent banner and select Hide from the context menu. The element will be hidden from the preview.
Option 2 - Disable styles and images
Open the Options menu in the page preview and uncheck Show styles and images. This strips all visual styling, which often makes cookie consent overlays disappear along with other decorative elements.
I would like to monitor changes in PDF, JPG, DOC, DOCX, XLSX, AVI and other media files, is it possible?
Yes. Wachete is able to extract text from PDF, XLSX, MS Word and DOCX files and monitor them for changes. For other file types, we check if the size and the last modified time have changed, and if so, we notify you. Simply create a new task and enter the URL of the file you are interested in.
Can I monitor page which requires to log in with password before?
Yes. When creating a monitor, choose the "Just part of page" type. After loading the preview, enter your login and password and click Sign In. Once logged in, you can choose what to monitor. Flow monitors have symbol ᐅ
Can I monitor just a section of a web page?
Yes. When creating a new task, simply select the area you are interested in. You can select some text/number, a section on a page or the entire page.
Can I post-process the monitored content?
In some scenarios, it could be useful to process the data retrieved from the page. For this purpose, you can write your own expression and leverage our built in functions.
When creating your monitor, navigate to +Show advanced options -> Content and enter your expression. Content retrieved by wachete is stored in the cv variable.
List of all supported functions can be found here.
Expression examples:
Extract first 5 characters from the content: substring(cv, 0, 5)
Extract element from JSON: jsonpath(cv, "$[?(@.definition.method=='GET')].definition.name")
Add suffix to the content: cv + '$'
What functions and operators are supported in expressions?
| Name | Description |
|---|---|
| + | Numeric or string addition |
| -, /, *, %, ^, () | Numeric operators |
| <, >, <=, >=, ==, &&, ||, !=, ! | Logical operators |
| abs(value) floor(value) ceil(value) round(value, decimals) |
Numeric functions |
| replace(string, oldString, newString) | Returns a new string in which all occurrences of a oldString string in the current string are replaced with newString |
| substring(string, startIndex) substring(string, startIndex, length) |
Returns a substring |
| contains(value, 'text') !contains(value, 'text') |
Returns whether string contains or not contains a substring. Function is case insensitive. |
| trim(value) | Returns a new string in which all leading and trailing occurrences of a set of specified characters from the current string are removed. |
| nl() newline() |
Returns a newline string. |
| indexof(value, 'text') | Returns zero based index of the substring in string. If not found -1 is returned. Search is case insensitive. |
| length(value) | Returns length of the string. |
| jsonpath(string, path) | Returns JSON element. See jsonpath.com for more details. |
Can I combine values from multiple monitors?
It might be useful to combine values from several monitors into one. A good example is monitoring a stock price in USD in one monitor and
the exchange rate between USD and EUR in another. You can combine these by creating a Compute monitor. Compute monitors have symbol ⚙
When creating a new monitor, choose the Combine values from existing monitors option and select the relevant monitors as sources of data. You can pick up to 5 monitors.
Name each monitor (e.g. usd_to_eur and google_stock_price) and write your own expression combining these names (e.g. usd_to_eur * google_stock_price).
These names can also be used in notification expressions.
We will generate history and chart the same way as for ordinary Monitor.
List of all supported functions can be found here.
Can I export my monitors which I monitor or data?
There are 3 ways how you can export data from wachete.
In monitors view select with small checkbox in right bottom corner all monitors you want to export. You can select up to 20 of them. Press Export button on top.
Excel file will be generated with last 100 values from selected monitors.
Second option is to select monitors same way like in above step, but this time click Edit button on top. Multi-edit window opens and on bottom you find button Export.
You will be able to download text file with all URLs and names of monitors you monitor. This text file can be also used to again import your monitors to our system, by copy&paste it to multi-edit text box.
Last option is to navigate to Profile -> Account and click Export monitored URLs. This will provide Excel file with all URLs you have in system.
Is there a way to search my monitors by name, URL, or note?
You can use the search box at the top above your monitors. Start typing - without pressing Search or hitting Enter, we will search the current folder by monitor name, note, or URL.
Click the MORE button at the bottom to see all results in the current folder.
When you click Search, we will search across all your monitors in all folders and show you up to 500 results.
It's possible to search in name, url, note and type. Full query specification can be found here.
Supported search values for type are:
normal - "Single page with normal type" monitors
dynamic - "Single page with dynamic type" monitors
scan - "Scan the root page and also the sub-pages" monitors
combine - "Combine values from existing monitors" monitors
Here are some example search queries:
type:dynamic - all dynamic monitors
chicken - monitors which contain 'chicken' in URL, name of monitor or note
name:chicken - monitors which contain 'chicken' in name of monitor only
name:chicken AND note:bio - monitors which contains 'chicken' in name and note contains 'bio'
name:chicken OR url:bio* - monitors which have word 'chicken' in name or URL contains word starting with 'bio'
Is it possible to randomize the value provided in HTTP request headers?
Sometimes it is useful to randomize value you provide in request headers. For this purpose, you can use following placeholders:
{random-number} - random number from interval <0; 100000)
{random-number:%number%} - random number from interval <0; %number%)
{random-text} - random text with 10 characters
{random-text:%number%} - random text with %number% characters. Maximum 100 characters are generated.
Sample headers:
User-Agent: {random-text:20}.{random-number}
User-Agent: Mozilla/5.0 (Windows NT 10.0; Win64; x64; rv:81.0) Gecko/20100101 Firefox/81.{random-number}
Is it possible to provide my own proxy server?
You can provide your own list of proxy servers.
This allows you to use datacenter or residential proxies in any location of your selection and limitation is only the offer of the proxy provider.
You can pick any proxy provider supporting username & password authentication, e.g. Smartproxy or Oxylabs
To minimize risk of blocking your proxy, we recommend using rotating residential proxies.
Be aware that Wachete is not caching any data between requests, so even though we're not loading images, videos or other multimedia content, the amount of transferred data could be still high especially for dynamic pages.
This depends on the page itself and monitoring period.
This could affect the price for the proxies.
After registering a proxy server in any of your preferred proxy providers, navigate to Profile -> Proxy and enter your proxy name, address and proxy credentials. If no user name and password are provided, no credentials are provided when authentication to the proxy server.
To verify that your server is working properly, open e.g. https://www.iplocation.net inside the Wachete page preview and check that the location is correct:
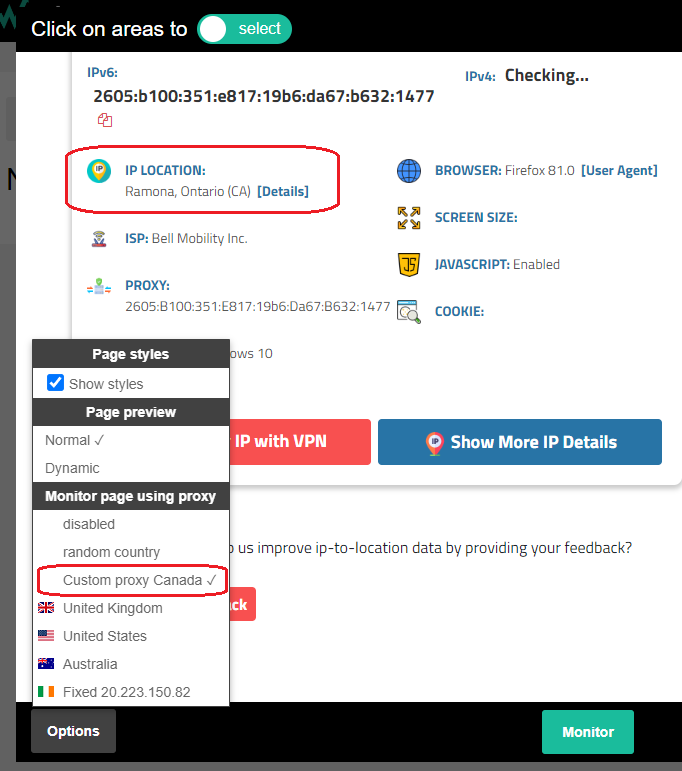
When proxy server is defined, you can use it the same way as you're using our predefined proxy servers:
* select monitoring location in Options while in page preview
* edit monitor and navigate to +Show advanced options -> HTTP -> Wachete will monitor page using proxy
Pricing, free plan, and paid subscriptions
Other monitoring services cap the total number of checks per month. Does Wachete do the same?
No - Wachete does not impose any monthly check cap. Many competing services advertise short check intervals but quietly limit how many checks you get per month (for example, "1,000 checks/month"). Once you use that budget up, your monitoring pauses until the next billing cycle.
Wachete works differently: once you pick a plan, every page you monitor is checked at the plan's chosen interval 24/7 for the full billing period. There is no monthly check budget, no throttling once you "use the plan too much," and no per-check fee - you pay only for the number of pages you monitor and the interval at which we check them.
I am interested in a paid subscription, can I cancel any time?
Yes. You can cancel any subscription at any time.
Can I share my subscription across team or with other accounts?
If you want to share your subscription with other people who have their own accounts, first ask them for their userID.
They can find it by navigating to Profile -> Team. It looks like this: 54c66df2-3f01-4419-80d1-1d5....
Now in your Profile -> Team click in sharing subscriptions New and enter previous ID and count of Static and Dynamic monitors you allow him to consume.
It will be subtracted from your own subscription and available for user you shared it with. User will also inherit the same checking interval you have and other features.
You can cancel sharing anytime by clicking remove.
How can I cancel or change subscription?
You can cancel a subscription at any time by navigating to Profile and then to My Subscriptions. Click Cancel on the particular subscription.
If you want to change your subscription to get more monitors or a shorter checking frequency, you have 2 options.
You can either buy another subscription to increase the number of monitors and have 2 or more subscriptions running in parallel, or you can cancel the current one and get a larger subscription.
If you want to update billing information for a subscription, click Edit in My Subscriptions and update the address. You cannot update VAT or company name.
To update VAT or company name, you must cancel the subscription and subscribe again.
Crawling websites and monitoring sub-pages
Can I monitor a whole website including sub-pages without adding them manually?
Wachete is perfect for monitoring a whole website including sub-pages. It will follow all the links on the first page and crawl all the sub-pages. We will automatically start monitoring all the sub-pages we find. When creating a monitor, select Scan the root page and also the sub-pages. Crawling goes down to the 3rd level of sub-pages. As this may find several hundred sub-pages, you will probably need one of our paid subscriptions. You can also filter URLs you don't want to crawl in the advanced section. Crawling monitors have symbol ▤
What if I would like to crawl a whole website including sub-pages but monitor only a certain section on all pages?
During creation of monitor, select Crawling full page including sub-pages, afterwards button Change selected content. Select the area on the root page which appears on same place also on sub-pages. We will extract and monitor only this part. In advanced section URL filtering check option Ignore pages which return error.
REST API, webhooks, and developer tools
I am a webmaster and I would like to add a button to my page so visitors can monitor changes with Wachete and receive email notifications
Just copy the HTML code below to your web page:
Can I monitor a value inside JSON returned by a GET, POST, PUT, or DELETE request?
Yes, you can. Enter the URL and in the preview, select the part of JSON to monitor. For PUT and POST requests, see below in this document for how to monitor PUT/POST
Does Wachete have REST API interface?
Yes, we support all operations via REST API that are available on the web. You can add a new page to monitor, list monitored pages, get values of a monitored page, and check notifications or webhook/HTTP callbacks when a page has changed. Documentation can be found here
Can I use Wachete from an AI assistant like Claude (MCP)?
Yes. Wachete runs an MCP (Model Context Protocol) server, so AI assistants like Claude can create and read your monitors for you. Add this server URL in your assistant's MCP settings:
The first time you connect, your assistant opens a browser window and asks you to sign in to Wachete. After you log in, it can act on your account - there are no API keys to copy, and it only ever reaches your account through the same checks as the website.
What the assistant can do for you:
- Fetch a page and find the right part to watch - it reads the page and picks the XPath for you.
- Create a monitor - URL, name, how often to check, the part to monitor, and whether that value is plain text or a number (so greater/less-than alerts work on prices and stock). It adds a "value changed" alert automatically.
- Update a monitor - change its settings or move it to another folder.
- Organize with folders - create folders, list what is inside them, and rename or move folders.
- Search your monitors, get a monitor or its recent history by id.
For your safety the assistant can read, create and update, but it cannot delete monitors or folders.
Examples of what you can ask:
"Watch the price on this product page and check it every hour: https://example.com/widget"
The assistant fetches the page, finds the price element, sets it up as a number, and creates an hourly monitor for it.
"Monitor the careers page at https://example.com/careers once a day and let me know when it changes."
"Create a folder called Travel and add a monitor for this flight page in it." - or "Move my Widget price monitor into the Shopping folder."
"Show me all my folders, and what is inside my Shopping folder."
"Show me all my dynamic monitors." - the assistant searches your monitors (for example type:dynamic).
"What were the last few values for my 'Widget price' monitor?" - the assistant looks up its history and tells you.
Can I monitor also response from POST/PUT requests?
Yes, you can. When creating a monitor, enter the URL where you want to send the POST request, then click Next, skip selecting the area you want to monitor until you get to Advanced options
at the bottom of the settings. In the Other tab you can specify the method to use, the body of the request to be sent, and also headers in the format:
X-Auth-header: aabdddcc11
You didn't find the answer you were looking for?
Don't hesitate to contact us at info@wachete.com and we will answer any of your questions.
